
Regional forms of Devanagari (Survey Report)
Objective of the survey
As a type foundry working with the Devanagari writing scripts, we wanted to understand which variants of Devanagari letterforms from manuscripts, inscriptions and early print traditions are used now in digital fonts. Colonial British authority was established in Calcutta, where the first printed types were created, coining the term Calcutta-style of Devanagari, also known as northern forms of Devanagari. Bombay, a major city on India’s west coast, rose to global prominence in the 1800s through maritime trade. Lying in the Marathi linguistic zone (i.e., text is written in Devanagari), Bombay gave birth to the Bombay-style Devanagari type. Today, digital fonts copy traditions that were established in the metal type era, and it is not clear which of the Calcutta-style and/or the Bombay-style Devanagari are still preferred in their respective areas of use. While the history of the use of these forms has been documented, we wanted to gain an insight into current demographic and regional preferences of various forms of Devanagari. The result was a survey of Devanagari readers, to give us an understanding of readers’ preferences today, which we hoped would help us design fonts better suited to readers of Hindi, Marathi and Nepali. We aimed to ascertain which forms of Devanagari are used today, and which ones are no longer relevant.
The survey
We created an online survey to evaluate different graphic variants of 14 Devanagari characters, being those that change most significantly according to region, as documented in the separate research by Karthik Malli: Devanagari – The Makings of a National Character. These characters were numerals <1>, <4>, <5>, <8> and <9> and letterforms for <a>, <vocalic r>, <kha>, <cha>, <jha>, <nna>, <la>, <sha> and <k-ssa>.

Individuals were asked three questions for each character: which one they recognise, which one they currently use, and if they can recall, which one they learned at school. The survey included demographic-oriented questions, such as age and where the individual attended school, and in addition to English, the survey was translated into Nepali, Marathi and Hindi. In total, 396 responses across India and Nepal were collected. The survey was disseminated via Typotheque’s website and its Twitter account, as well as by approaching potential respondents via email lists and word of mouth. To ensure sufficient diversity of representative data, face-to-face responses were collected in Kathmandu and Pune. These two places were chosen because of their significance for the Devanagari script in both Nepali- and Marathi-speaking areas. Face-to-face sampling mainly took place in libraries, cafes and educational institutions across both cities. We interviewed all respondents who agreed to participate. No selection criteria was used for the participants of the online survey either. Given that the study comprised 42 questions, answers with a response time of less than 2.5 minutes were filtered out, as were incomplete entries. A total of 387 responses were used in the analysis of the data. The age of respondents ranged from seven to 86 years of age (average 32.9, standard deviation of 11.5), and the average time taken to complete the survey was 8.4 minutes.
Data was initially processed using Python scripting, which was used to investigate regional preferences. Subsequently, the open source statistics software JASP was used to measure other relationships and further validate trends. ANOVA studies, t-tests, the Friedman tests and regression studies were performed during the analysis of the data¹. These analyses were used to draw the conclusions and patterns stated below.
The Devanagari script
The Devanagari script emerged in the 7th century CE and reached maturity around the 13th century CE, being widely used in inscriptions and religious manuscripts. The major standardised languages written in Devanagari today – Hindi, Marathi and Nepali – largely share the same set of letters. However, since these languages have different phonological systems, these letters are not necessarily mapped onto the same phonetic units. In addition, certain phonemes in these languages that are not found in Classical Sanskrit are represented by extra letters. Furthermore, the same Devanagari letters used in various regions may take different forms, while still being represented by the same Unicode code point. The only instances of these differences on literature tend to use the sometimes reductionist labels of Calcutta- and Bombay-style, and such references are typically old (see for example page 113 of this manual of Devanagari, written in 1953).

Research findings
The letterforms have been organised into groups using the results obtained from the survey and previous hypotheses, based on what are commonly considered to be traits associated with them. For example, Form 2 chosen for A, NNA, K-SSA, JHA and vocalic R were studied together because of the existence of an archaic version of these.
LA, SHA and vocalic R

Recognition of the letterforms of this first group was fairly consistent. Form 2 of SHA [sha2] was the most troublesome out of the six versions. A comparison of the ages of those who could not recognise this alternative and those who could shows a significant difference between the two groups—after checking normality with Shapiro-Wilk, independent measures t-test returned that averages differed by 4.06 (p>.001, t=3.17). Respondents who had trouble with Form 2 [sha2] were significantly younger. Having examined the demographical data this survey collected, we concluded that no other factor than age could be used to justify this overall low recognition; we argue that individuals are not familiar with this alternative because it has fallen into disuse after the Indian standardisation of Devanagari during the late 1980s. In this respect, only older respondents are familiar with both alternatives.
No regional preferences were observed with the two vocalic R forms. The first of these alternatives [r1] was recognised by 82.3% of the population. When comparing age against recognition of this variant, no significant influence was observed (p=0.76, t=0.31). The same was found with Form 3 [r3] (p=0.11, t=1.60). This alternative resembles Gujarati’s vocalic R. Out of the 35 participants that speak Gujarati, 27 recognised this variant (77.1%). No other influence of language or other variable was observed.
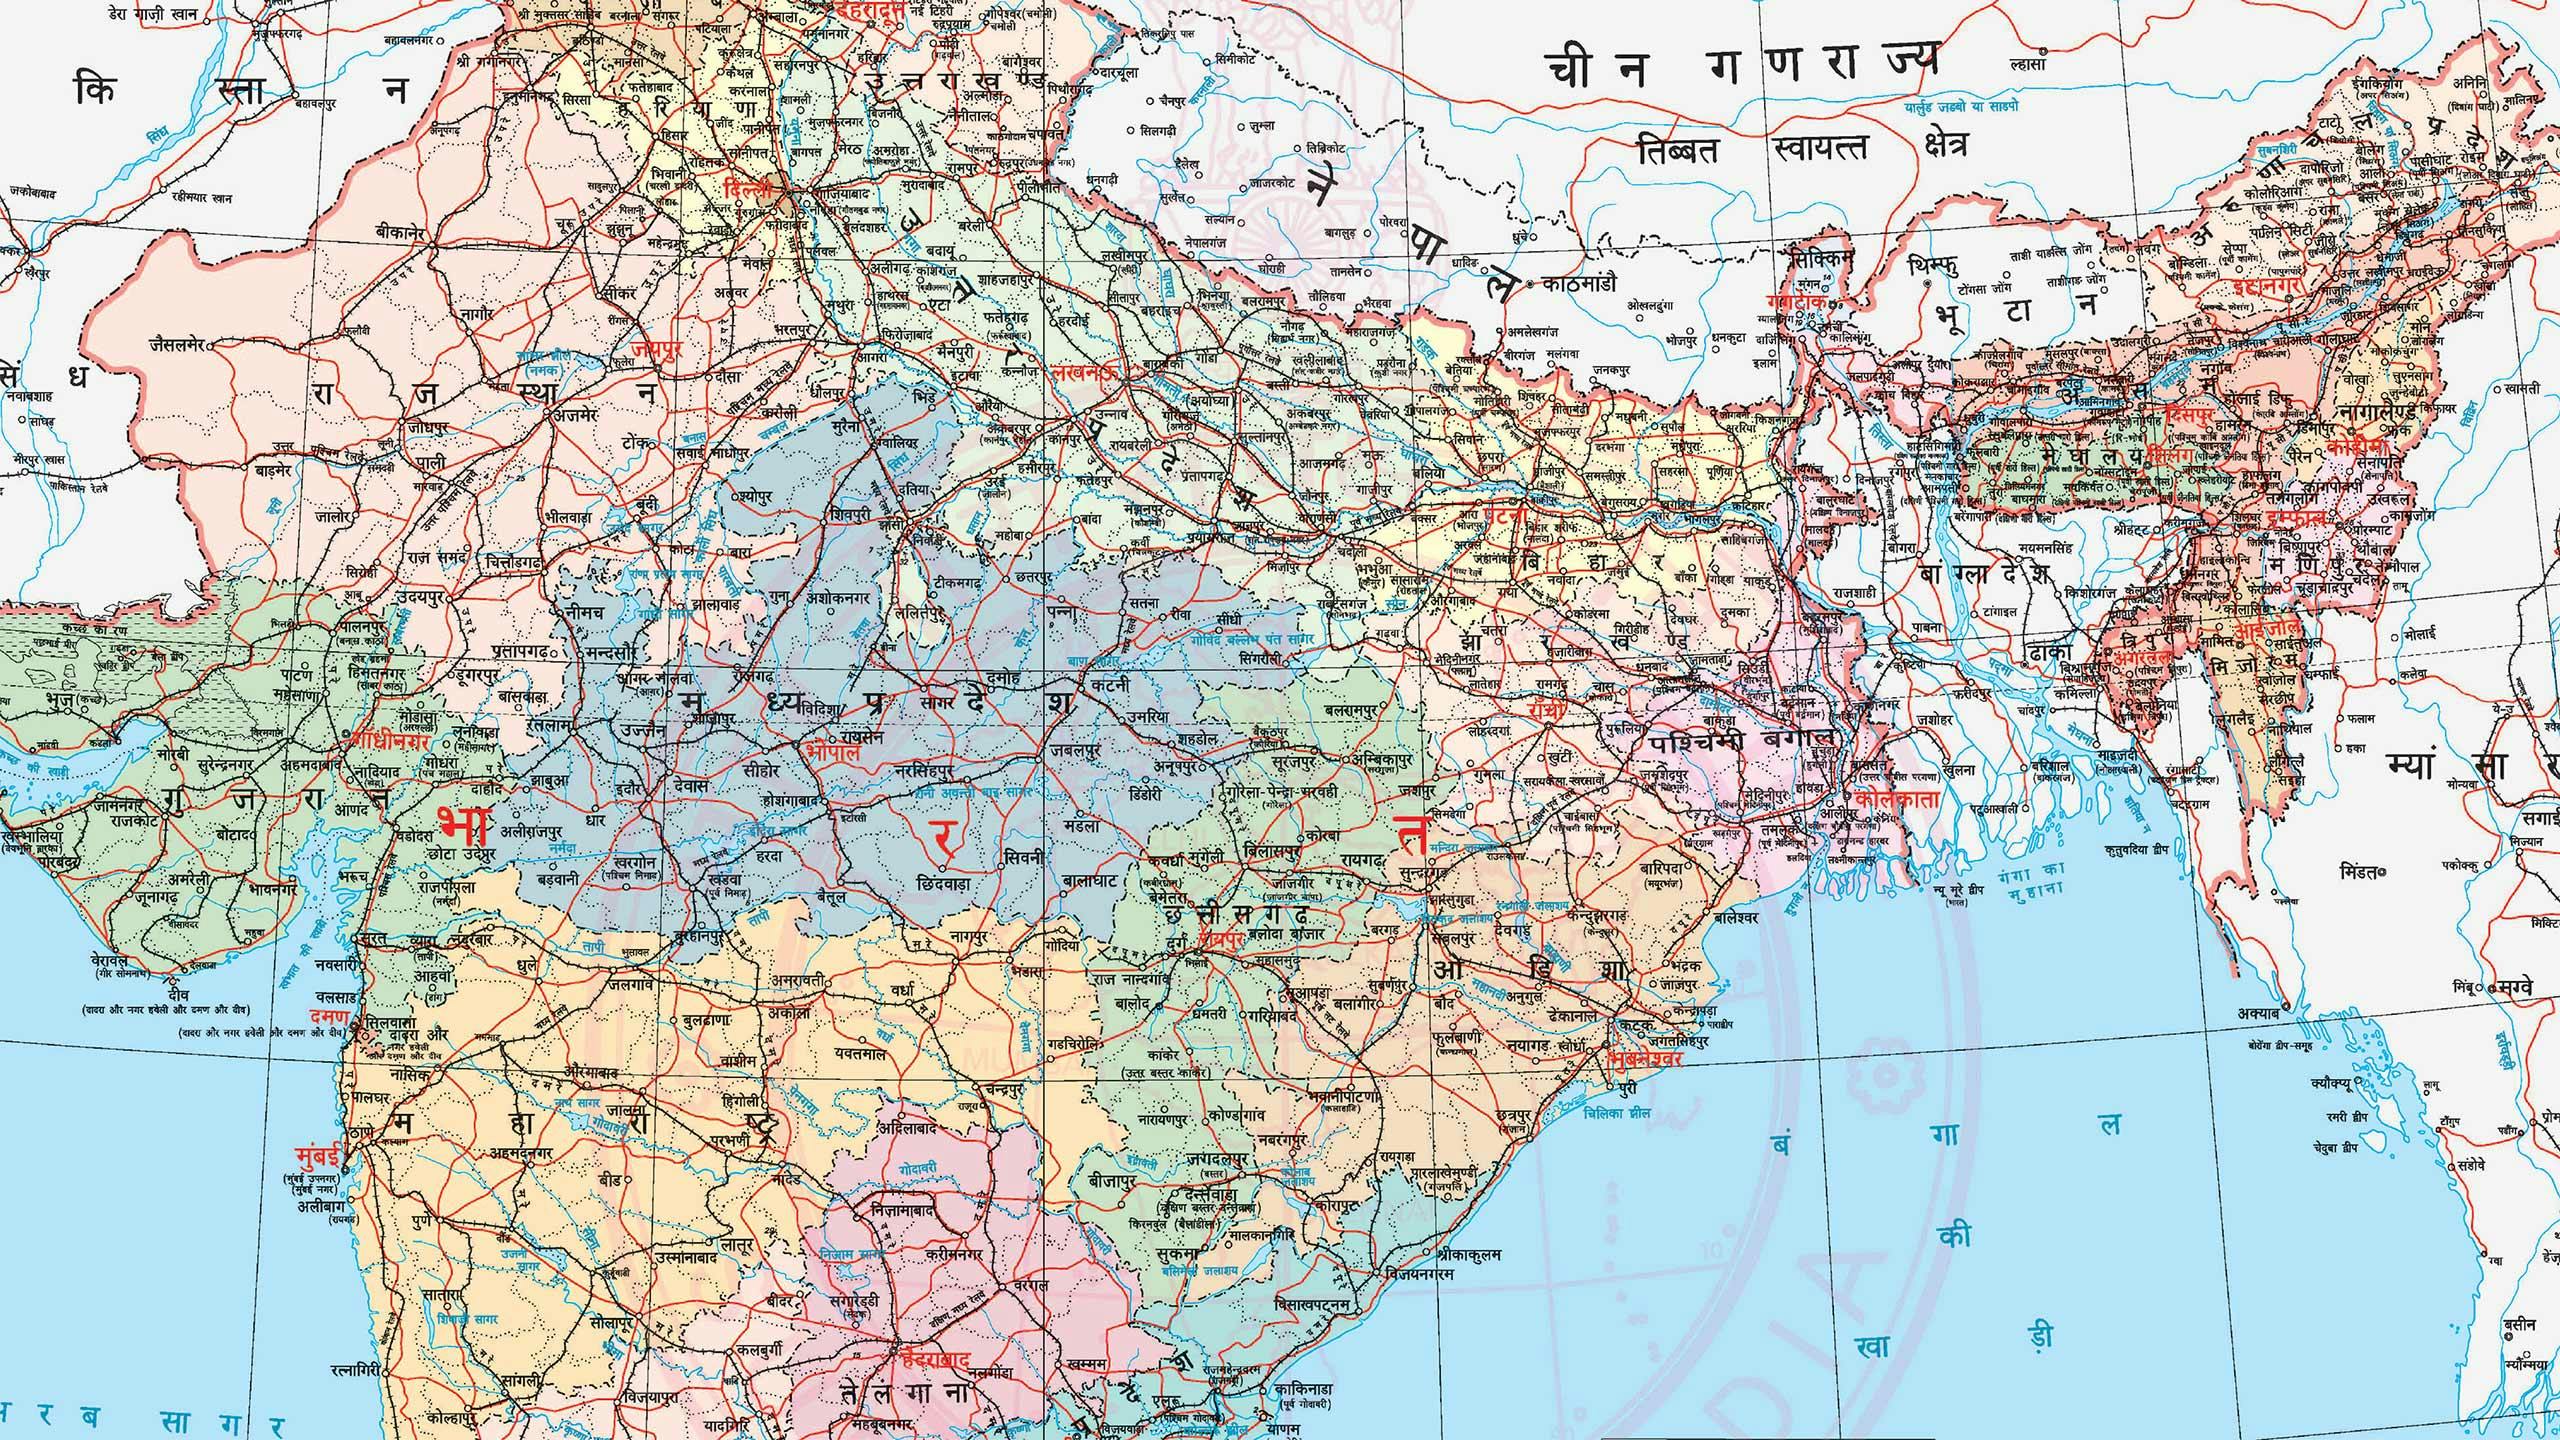
Typographers usually associate more modern and southern variations of the characters LA and SHA (Form 2 - [la2], [sha2]) as forms preferred by Marathi speakers. One of the questions asked in the survey was which was the first language they learned; this can be used to give a good sense of what native speakers of Marathi might prefer. A comparison of Marathi data with that of Hindi participants allowed us to generate the maps seen in Figure 4. Although it can’t be said that Form 2 of LA [la2] is significantly preferred by Marathi speakers, a considerable number of Marathi-speaking participants (35.8% of respondents who learned Marathi as their mother tongue), prefer this form over Form 1 [la1] (60.0%). In comparison, only 2.4% of participants who learned Hindi as their first language prefer Form 2 [la2] over 90.4% for 1 [la1] (see maps below).

When looking at letterform SHA preference, Form 1 [sha1] seems to be strongly preferred by both Marathi- and Hindi-speaking groups. A number of Marathi speakers showed a preference for Form 2 [sha2] (15%). Only 1.2% of Hindi natives preferred this alternative. See Figure 5.

Although some preference for LA Form 2 [la2] could be found among Marathi speakers, the surveyed population overall prefers Form 1 [la1] (80.5%) over 2 [la2] (14.9%). It was possible that older Marathi speakers differed in their preference from those who are younger, hence LA and SHA preference was also filtered by age. Older Marathi individuals prefer Form 2 of character LA [la2], and something similar happens with SHA [sha2]. On the other hand, younger Marathi speakers tend to prefer Form 1 for both variants - [la1], [sha1] (a binary logistic regression study showed an odds ratio between age and preference of 1.07 in both, with p=0.005 for LA and 0.006 for SHA). Hindi participants, though, show this preference across all ages. See bar graphs in Figure 6 for reference. The vertical axis represents the number of responses and age is distributed across the horizontal axis.

The data obtained shows that Form 2 of LA [la2] is preferred among older (45+) Marathi readers. Only this population group appears to show a preference for this form. With respect to SHA, preference for Form 2 [sha2] is low even among Marathi speakers. Although it seems like younger Marathi speakers strongly prefer Form 1 of both characters, it’s worth mentioning that the other form studied ([la2], [sha2]) is historically linked with Marathi linguistic and cultural identity. Both forms are considered markers of Marathi usage, and are preferred in the Government of Maharashtra’s written standard. Given the results of this study, though, which show higher preference for Form 1 ([la1], [sha1]) even among Marathi speakers, we currently recommend the first form for both characters ([la1], [sha1]) across all regions and ages.
When looking at the letterform for vocalic R, both Forms 3 [r3] and 1 [r1] of this character are believed to be similarly popular. Recognition of both versions is fairly consistent throughout (78.3% for Form 1 [r1] and 82.3% for Form 3 [r3]), but when examining preference, most participants claim to prefer the first of the two (73.4% compared to 25.1% for Form 3 [r3]; 1.5% claimed to have no preference). There’s a small gradient towards the north when looking at the preference for Form 3 [r3]. Nepal respondents showed a slight proclivity for this alternative (53.91% compared with 39.84% for its counterpart. The remaining 6.25% did not have a preference). This extended somewhat to other regions nearby, which showed an even smaller preference. See Figure 7 for reference.

The age of Nepal respondents was compared against preference for both alternatives of vocalic R, and no significant relationship was found (binary logistic regression odds ratio of 0.99, p=0.69).
We would recommend only using Form 1 [r1] of vocalic R in specific contexts when targeting a known audience in Nepal. Thanks to the data gathered, we have observed better recognition of this version over Form 3 [r3], but only Nepali respondents claim to prefer Form 3 [r3] for general use. In all other regions and across languages and age groups, Form 3 [r3] is preferred. Therefore, we generally recommend using Form 3 [r3] except in the aforementioned very specific case of a known target.
KHA and CHA

Both variations of KHA and CHA are strongly recognised. Form 1 for both ([kha1], [cha1]), though, seems more familiar to most participants. Respondents towards the south of India appear to have more issues with Form 2 for both characters ([kha2], [cha2]), especially CHA [cha2] (29.0% of respondents from Maharashtra didn’t recognise this version, while only 13.9% of Nepal participants did so). A slight north–south gradient can be observed when looking at the recognition of both Form 2 letterforms ([kha2], [cha2]), with better recognition towards the north of India and Nepal. Historically, this also lines up with the origin and use of these letterforms. When looking at preference, the older, traditional forms of these characters ([kha2], [cha2]) are also preferred in the north of India and Nepal, while their more modern counterparts ([kha1], [cha1]) are preferred in the south of the Hindi-speaking areas. The education-oriented responses validate this assumption further (data was found not to be parametric using Shapiro-Wilk [p<.001], so the Friedman test was used and returned a strong agreement between education and preference for both KHA [Kendall’s W of 0.82] and CHA [W=0.71]).

When comparing the first language of the respondents and their preference for these characters, the results showed some significant interactions (using a logistic regression study). Estimates from the regression model demonstrated that the most significant results were with Nepali speakers, who strongly preferred CHA Form 2 [cha2] (87.7% of respondents); Marathi speakers, who had a preference for Form 1 [cha1] (96.9%), as well as Gujarati speakers (94.4%). These results corroborate geospatial preference data for more informed decisions.

The indication is that Form 2 for both characters ([kha2], [cha2]) is preferred by older people, hence an age analysis was carried out. After checking for normality, an independent t-test was performed with age of respondents being used for each alternative of KHA. The results showed a significant difference in the average age of both groups (p<.001, t=4.04).To understand this better, data was split into age groups, and a skew towards Form 1 [kha1] in younger ages was observed (see Figure 10); none of the 11–20-year-old participants decisively preferred Form 1 [kha1] over Form 2 [kha2], whereas 36.36% of 61–70-year-olds preferred Form 1 [kha1].
The same analysis was performed with data collected with the letterforms for CHA. Independent t-test results showed that there was a significant difference in the ages of respondents who preferred Form 1 [cha1] over Form 2 [cha2] (p<.001, t=3.61). Subsequent age-grouped analysis was also performed and can be seen in Figure 10. A clear trend shows that younger respondents prefer Form 1 [cha1] (85.20% of 10–20-year-olds), whereas participants in older age ranges prefer Form 2 [cha2] (30% of 50–60-year-olds, and even smaller percentages as we increase age). Binary logistic regression results support these relationships further, with an odds ratio of 1.04 (p<.001) between KHA preference and age and 1.04 (p<.001) between CHA preference and age.
Based on these results, we recommend the following advice. Both characters are generally recognised, possibly because of their graphic similarity. We have observed a north–south gradient, with a stronger preference for Form 1 ([kha1], [cha1]) towards the south, and a preference for Form 2 ([kha2], [cha2]) in the north. In addition, age has been shown to influence preference, as older participants significantly prefer Form 1 ([kha1], [cha1]) for both. For these reasons, for KHA and CHA, two factors ought to be considered when choosing between options (see Figure 11).

A, NNA, K-SSA, JHA, and archaic vocalic R

The analysis of these variations was grouped based on their history. Form 2 for all of these has an older origin and is considered by type designers as archaic, therefore little to no preference or even recognition was expected. However, results varied considerably between characters. Form 1 for all of these letterforms is the most recognised overall, with JHA Form 1 [jha1] scoring the highest out of this group (95.7% of participants recognised it) . Out of the modern forms, vocalic R Form 1 [r1] scored the lowest (82.3%). No significant difference in age was found between the participants who recognise this form and those who don’t. Nor was any language association found. It could be argued that this low result was because of the reduced use of this character in day-to-day written language. Although recognition for Form 1 of most characters remained fairly high, that for Form 2 varied widely across characters. Form 2 was generally better recognised towards the north (see Figure 13 for maps).

Little to no preference for Form 2 was found against the more modern alternatives of all these characters (2.41% for A [a2], 2.14% for NNA [nna2], 2.41% for K-SSA [ksha2] and 1.52% for vocalic R [r2]). The very few participants that reported preferring these versions were in the north. Form 2 for JHA [jha2], though, was significantly more preferred by participants in this region, especially in Nepal (83.87% of Nepal respondents preferred it in comparison to 16.13% for Form 1 [jha1]). The data collected also indicated that this alternative ([jha1]) was the one taught in schools across Nepal (data was found to not be parametric using Shapiro-Wilk, so the Friedman test found a strong agreement between education and preference – Kendall’s W of 0.90). This alternative ([jha1]) does not seem to be taught in any of the other regions studied.
Given these results, we recommend using Form 1 of these characters ([a1], [nna1], [ksha1], [jha1], [r1]) over the archaic Form 2 ([a2], [nna2], [ksha2], [jha2], [r2]) in all cases but one: when using JHA for readers from Nepal. In this case, Form 2 [jha2] is recommended. For all other regions and languages, Form 1 for JHA [jha1] is a better fit across regions, languages and ages.


Numeral 1
In terms of numeral 1, Form 1 [one1] was better recognised than the second alternative [one2] (92.8% vs 81.5%). Practitioners do not usually associate either of the alternatives of this character with a certain region, and hence no trend was expected with this numeral. Surprisingly, although no strong gradient was observed, respondents from Nepal strongly preferred the first form [one1] (82.0% compared with 12.2% for Form 2 [one2]). Throughout India, no strong preference for either form was significant. Participants in the more southern areas of India seem to demonstrate somewhat worse recognition of Form 2 [one2] (for example, 66.6% of participants in Andhra Pradesh reported having trouble with this alternative, while only 15.2% of Nepal respondents did). This data aligns with that relating to teaching, as Form 2 [one2] was taught in these regions more than the other alternatives.

A binary logistic regression study between preference and age returned an odds ratio of 1.00 and p=0.69, hence age does not seem to play a role in the preference for this character. When separating respondents by mother tongue, Marathi speakers showed a significant preference for Form 2 [one2] (61.9% compared with 38.1% for Form 1 [one1]), while Hindi speakers preferred Form 1 [one1] (59.7% against 40.3% for Form 2 [one2]).
Given the data collected, we recommend using Form 2 [one2] for this character when targeting Nepal or a population of first-language Marathi readers. In other cases, we suggest using Form 1 [one1] because of its wide recognition, significantly higher that of Form 2 [one2].
Numeral 4
For numeral 4, a very high recognition for both alternatives is evenly distributed across India and Nepal, with similar percentages: 93.0% and 90.4% respectively. Equally to other characters (such as Form 2 for numerals 5 [five2], 8 [eight2] and 9 [nine2]), the second alternative of this numeral is normally more preferred in the north. However, this is not true for Form 2 of numeral 4 [four2], with the results showing a preference for each alternative being evenly distributed across the regions of interest. Overall, there is a very slight preference for the second alternative (52.6% compared with 47.5%), for which a factor other than location might be influencing preference for either variant.

When examining data on education, we can see that most responses for Form 2 [four2] come from participants who learned how to write in the north, specifically in Nepal (74.5% compared with 25.5% for Form 1 [four1]). It could be argued that schools towards the north still teach this variation, hence age may well play a role in preference. Surprisingly though, results from a binary logistic regression study show no significant relationship between age and preference (odds ratio of 1.00, p=0.67). Hindi speakers show no strong preference for either alternative (54.84% vs 45.16%), nor do Marathi speakers (41.54% vs 58.46%).
With the data obtained, we do not feel able to provide a recommendation for either alternative for a specific context. None of the factors of age, region or language affect preference, and given that recognition is wide for both alternatives (over 90% of participants recognised both [four1] [four2]), we think that, for numeral 4, the choice of one alternative over the other is purely stylistic.
Numeral 5
The two forms for numeral 5 were recognised evenly (72.9% and 75.1%), with slightly higher results towards the north for Form 2 [five2] (see Figure 17 for maps). In terms of preference, the north–south gradient we previously expected with numeral 4 is clearly visible with this numeral. Results show that there is indeed a strong preference for Form 2 [five2] in the north, while Form 1 [five1] is more common in the south. This aligns with data collected on education (non-parametric data according to Shapiro-Wilk, so the Friedman test found strong agreement between education and preference – Kendall’s W of 0.80 with p<.001). Preference was compared against age using binary logistic regression, and no significant relationship was found.
Marathi speakers prefer Form 1 [five1] (79.6% against 20.34% for Form 2 [five2]), while Hindi speakers prefer Form 2 [five2] (91.04% compared with 8.96% for Form 1 [five1]), but not as strongly as Nepali speakers (96.49% compared with 0.01% for Form 2 [five2]). No pattern of age was found in Hindi speakers that prefer Form 1 [five1].

For numeral 5, we recommend using Form 1 [five1] when targeting a population of readers in Maharashtra or one that speaks Marathi. If the readers are Hindi speakers or from Nepal or surrounding Indian states, we recommend using Form 2 [five2]. Recognition of both is evenly distributed, regionally and age-wise, hence the advice is not based on what the population will recognise, but what they seem to prefer.
Numeral 8
Numeral 8 Form 2 [eight2] was not well recognised, with only 65.2% of participants being familiar with it. Respondents who didn’t recognise this form were mainly from the south (see Maharashtra in Figure 19, where only 41.8% of participants recognised it). Form 1 for this numeral [eight1], though, was evenly recognised by 87.4% of the respondents.

Results show that there is indeed a strong preference for Form 2 [eight2] in the north, while Form 1 [eight1] is more common in the south. No significant effect of age was found on preference (using a binary logistic regression study). Marathi speakers strongly prefer Form 1 [eight1] (95% against 0% for Form 2 [eight2]), while Hindi speakers do not show a strong preference (48.61% and 51.39% respectively), and Nepali speakers prefer Form 2 [eight2] (85.71% compared with 14.28% for Form 1 [eight1]).
For numeral 8, we recommend Form 2 [eight2] for respondents in Nepal and surrounding states. For speakers of Marathi or inhabitants of Maharashtra or more southern areas, we recommend that Form 1 [eight1] is used.
Numeral 9
Out of the three versions of numeral 9 studied, Form 1 [nine1] was the most recognised (78.0%), particularly towards the south, where it predominates over the other two. The other two variants were mainly recognised in the north, with over a third of participants from Nepal being able to recognise at least two variants.

The first alternative is the most commonly used across India and Nepal (81.7%). Preference for the other variants is low overall, and the few participants who claimed to prefer it were generally from the north, especially for Form 2 [nine2].

We hypothesised that age might influence the preference for each of the alternatives of numeral 9. Two binary logistic regression studies were performed to look for such a pattern, which compared age and likelihood of choosing either Form 2 [nine2] or 3 [nine3] over Form 1 [nine1]. Estimated plots of these results can be seen in Figure 22. Odds ratios were 1.03 (p=0.04) and 1.04 (p=0.16) respectively. Older respondents seem to significantly prefer both Forms 2 [nine2] and 3 [nine3], particularly the former.

According to this data, we recommend using Form 1 for numeral 9 [nine1] in almost all circumstances. Most participants in all regions prefer this alternative, and it is the best recognised. Only older readers from the north will have a preference for Form 2 [nine2]. Our data shows that participants who preferred these alternatives still reported understanding Form 1 [nine1] as well. We do not recommend the use of Form 3 [nine3].
Summary
We designed an online survey to assess the regional preferences of Devanagari letters, and collected 387 responses, which were analysed using the information gathered on the reader’s age, the place they learned to write Devanagari, which languages they speak and their language proficiency.
The obtained data provides information about the current reading preferences in terms of typographical variants of Devanagari characters. This research provides empirical information to inform type designers and typographers addressing specific readers of the Hindi, Nepali and Marathi languages.
We gathered data not only on the recognisability of each form of the Devanagari characters, but also on the preferences of readers and users. When a certain shape is not recognisable by the majority of readers, we recommend avoiding these forms entirely. An exception can be made when designing historical fonts that intentionally choose archaic shapes. An individual reader’s preferences provide a spectrum of options for type designers, especially when multiple variants are sufficiently recognisable, so designers can choose the shapes that better fit the objectives of the font, and provide a stylistic fit with the rest of the characters. Specific recommendations about the choice of typographic variant for a specific reader segment are listed below. It is our hope that these recommendations can improve future fonts and accessibility of text using the Devanagari script. For the historical information about the printing traditions of Devanagari, read also our essay Devanagari – The Makings of a National Character.
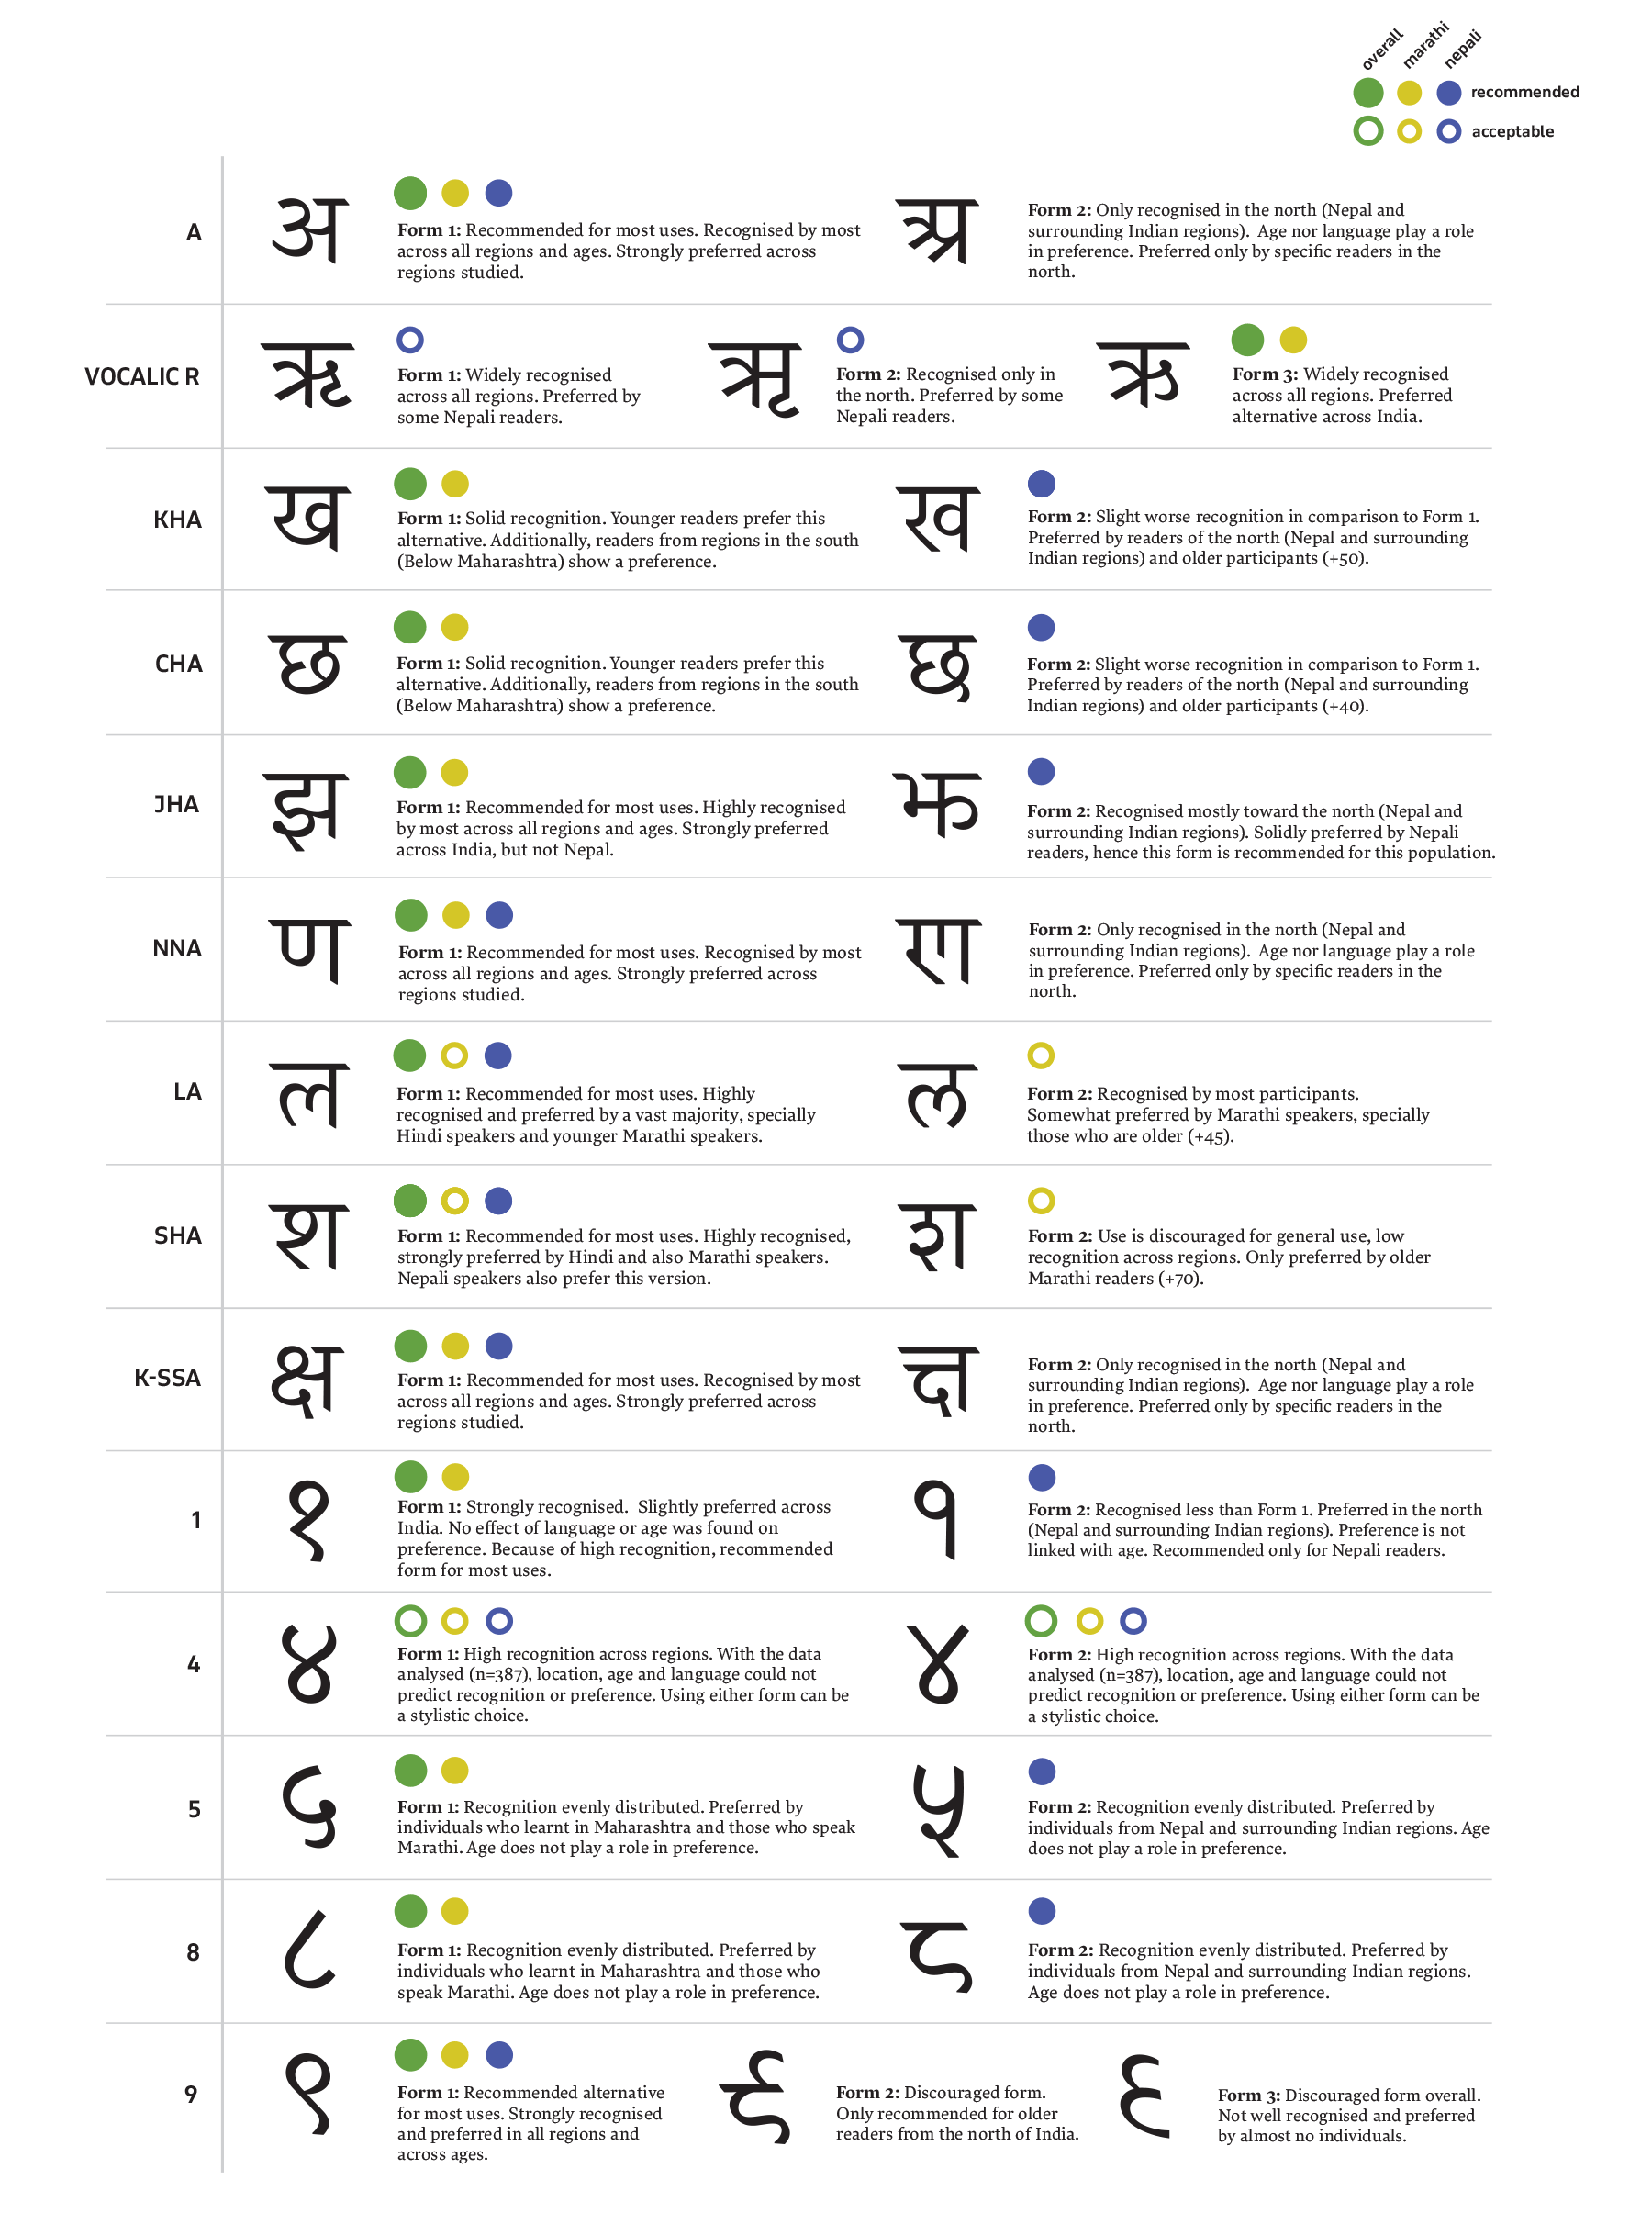
Summary of Findings
Colophon
Survey questionnaire: Peter Biľak, Liang Hai, Karthik Malli, Parimal Parmar Devanagari variant design: Parimal Parmar (Lava Devanagari) Data analysis: Héctor Mangas Reporting: Héctor Mangas Editing: Peter Biľak Proofreading: Johanna Robinson Python scripting: Liang Hai On-ground survey: Sanjeev Pandey (Kathmandu), Mrunal Kulkarni (Pune) Peer review: John Hudson, Tiro Typeworks